


Description
<p>Sensoteq Analytix offers a streamlined interface for effortless, remote data visualisation. It automatically dissects data, presenting it to the user in an intuitive hierarchical format, enabling swift identification of underperforming or at-risk machines. Delve into the intricacies of time waveforms and spectrums, equipped with a diverse set of analytical tools for in-depth analysis.</p>
<h2><strong>Features</strong></h2>
<h3><strong>Real-Time Data</strong></h3>
<p>Displaying data in real-time is crucial for immediate decision-making. Analytix provides live updates and allow users to view the current status of monitored equipment.</p>
<p> </p>
<h3><strong>Alarms & Notifications</strong></h3>
<p>Set up custom alerts by email or text to enable proactive maintenance. By alerting users when sensor data indicates abnormal conditions, such as excessive vibration or temperature, failures are avoided.</p>
<h3><strong>Historical Data Analysis</strong></h3>
<p>Store historical data to analyse trends, compare performance over time, and identify potential issues before they become critical. Access and analyze past sensor data easily.​</p>
<h3><strong>Reporting Tools</strong></h3>
<p>Built-in reporting and analytics tools includes features like trend analysis, predictive maintenance insights, and the ability to generate detailed reports on equipment health and performance.</p>
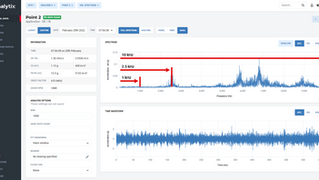
<p><strong>Time Waveform & Spectrums</strong></p>
<p>Identify anomalies, vibration-related issues, and energy inefficiencies, ultimately extending equipment longevity, reducing costs, and ensuring compliance with regulations. With data-driven decision-making, users can proactively address problems, contributing to more efficient and reliable operations while minimising unplanned downtime and costly emergency repairs.</p>
<p><strong>Auto-Correlation</strong></p>
<p>Enables the identification of repetitive patterns and cyclical behaviors, which are critical for fault detection and the early recognition of machinery issues. Auto-correlation helps pinpoint the frequencies associated with vibration sources, aiding in root cause analysis and predictive maintenance by monitoring equipment behavior changes over time. Furthermore, it serves as a tool for data validation, reducing false alarms, and optimising operational efficiency.</p>
<p><strong>Waterfall Plots</strong></p>
<p>A multi-dimensional view, integrating time, frequency, and amplitude data, facilitating in-depth frequency analysis and change detection. Waterfall plots enable comparative analysis of different time periods and equipment, aiding in fault detection and tracking historical trends. Moreover, they assist in evaluating the effectiveness of maintenance measures and serve as a clear means of communicating complex data.</p>
<p><strong>Circular Plots</strong></p>
<p>A visual representation of data, aiding in the quick understanding of complex datasets and patterns. These plots enable the efficient identification of trends, early fault detection, and precise alignment of machinery components, contributing to improved maintenance strategies and operational efficiency.</p>

Reviews
There are no reviews yet.